X-ray diffraction plots were considered nearly impossible to screen for duplication, until recently. In our recent webinar, Imagetwin co-founder and CTO Marcus Zlabinger sat down with Mu Yang, PhD, a behavioral neuroscientist at Columbia University Medical Center who has become one of the most active research integrity sleuths working in XRD, glass, and spectra images. She walked through how she spots duplicated traces by eye, and Marcus shared what Imagetwin’s new automated XRD detection feature found when it was pointed at thousands of recent papers.
What is So Difficult about XRD Plots
XRD is used to confirm that a material’s crystal structure matches what a paper claims, and the peaks, widths, and baseline noise in a trace all carry real information. That also makes XRD data relatively context-poor compared to, say, a microscopy image, which is exactly why it took so long for any automated tool to reliably flag duplication in it. Peaks and baseline noise are the two things Mu Yang sees edited most often.
Four Things a Clean Trace Should Never Do
Before getting into specific cases, Mu Yang laid out the basics she checks on every plot:
- Traces should never travel backward
- Baseline noise is stochastic and should never repeat within or across traces
- Every point should have one x and one y value
- Unexplained line breaks are a red flag.
Common Issues and Red Flags
The three issues she flags most often are:
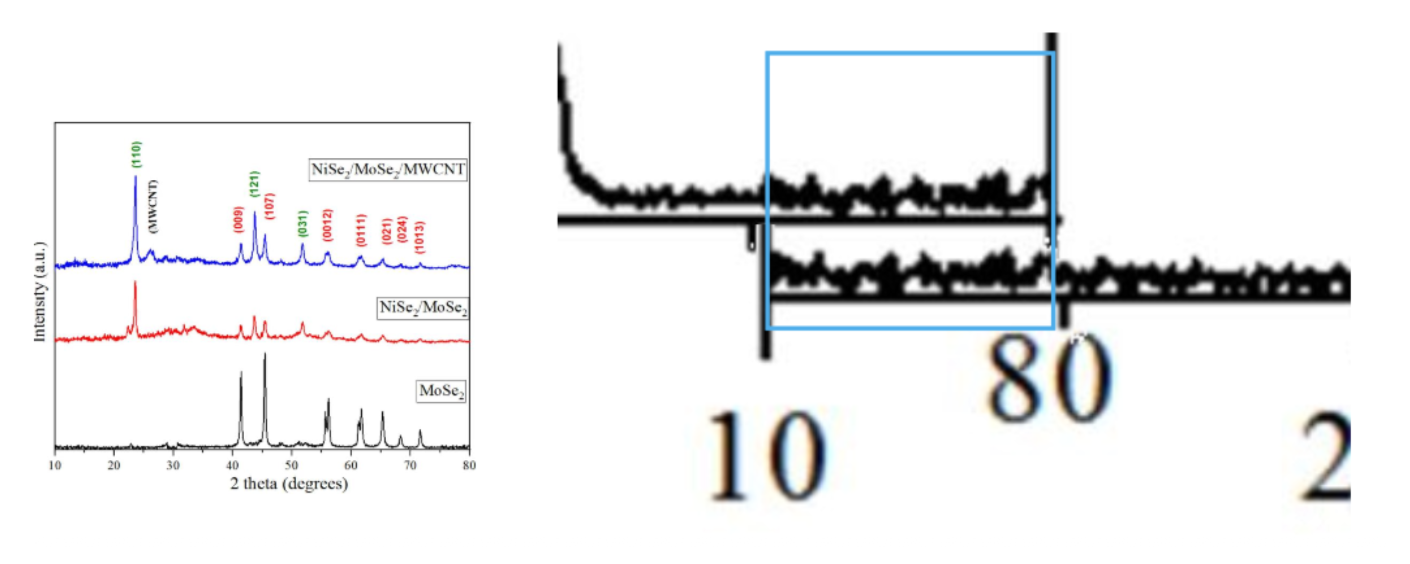
- Reused traces (usually the noise sections get recycled)
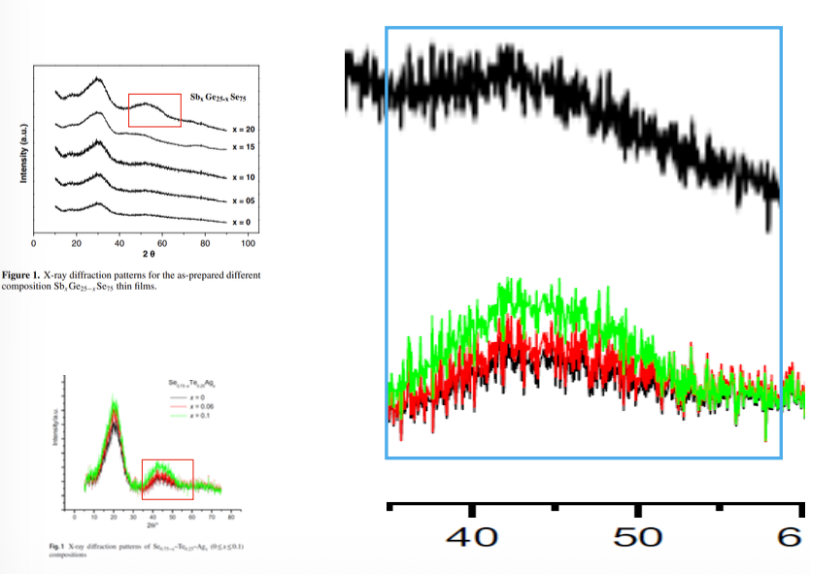
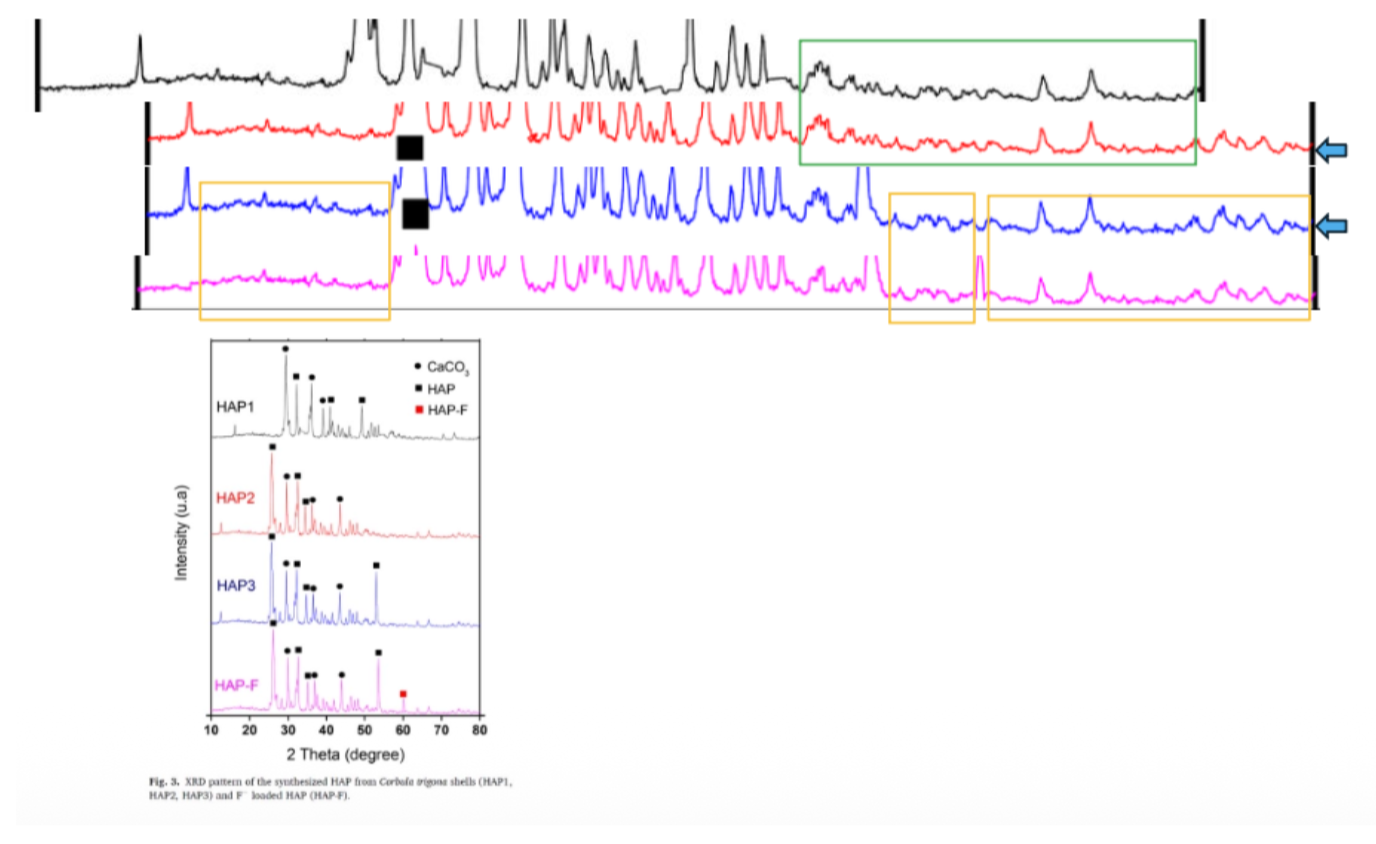
- “Patchwork” (chopping up traces and reassembling them to look new)
- Hand-drawn traces, which she says are the hardest to catch because they don’t always break a specific rule, they just look wrong.
On top of that, three visual cues tend to give away an edited plot:
- Unusually thick or chunky lines (easier to hide a seam in)
- Mislabeled axes (wavenumbers on an axis that should read 2-theta)
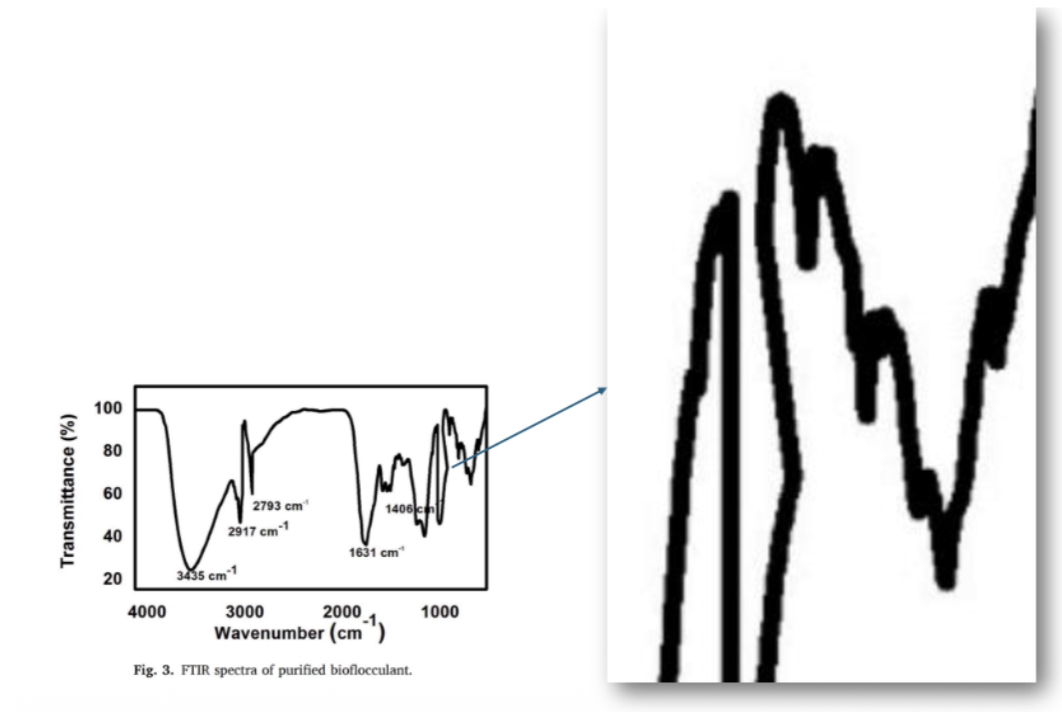
- Fuzzy axes, which often mean two images were stacked to fake a new trace.
How to Spot Issues in XRD in Practice
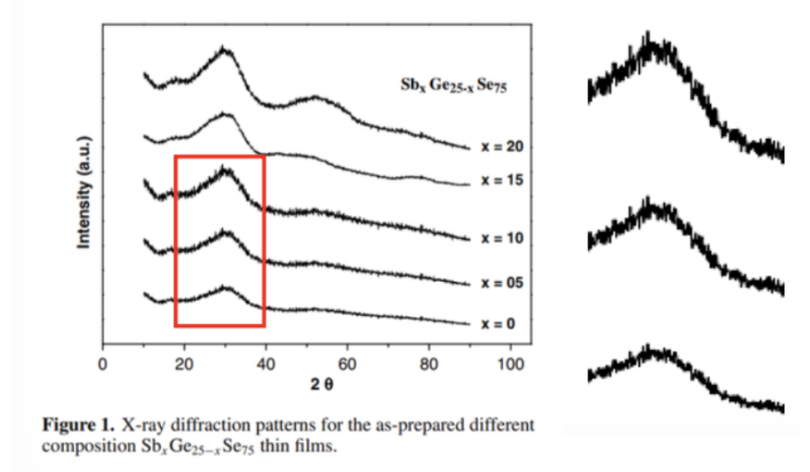
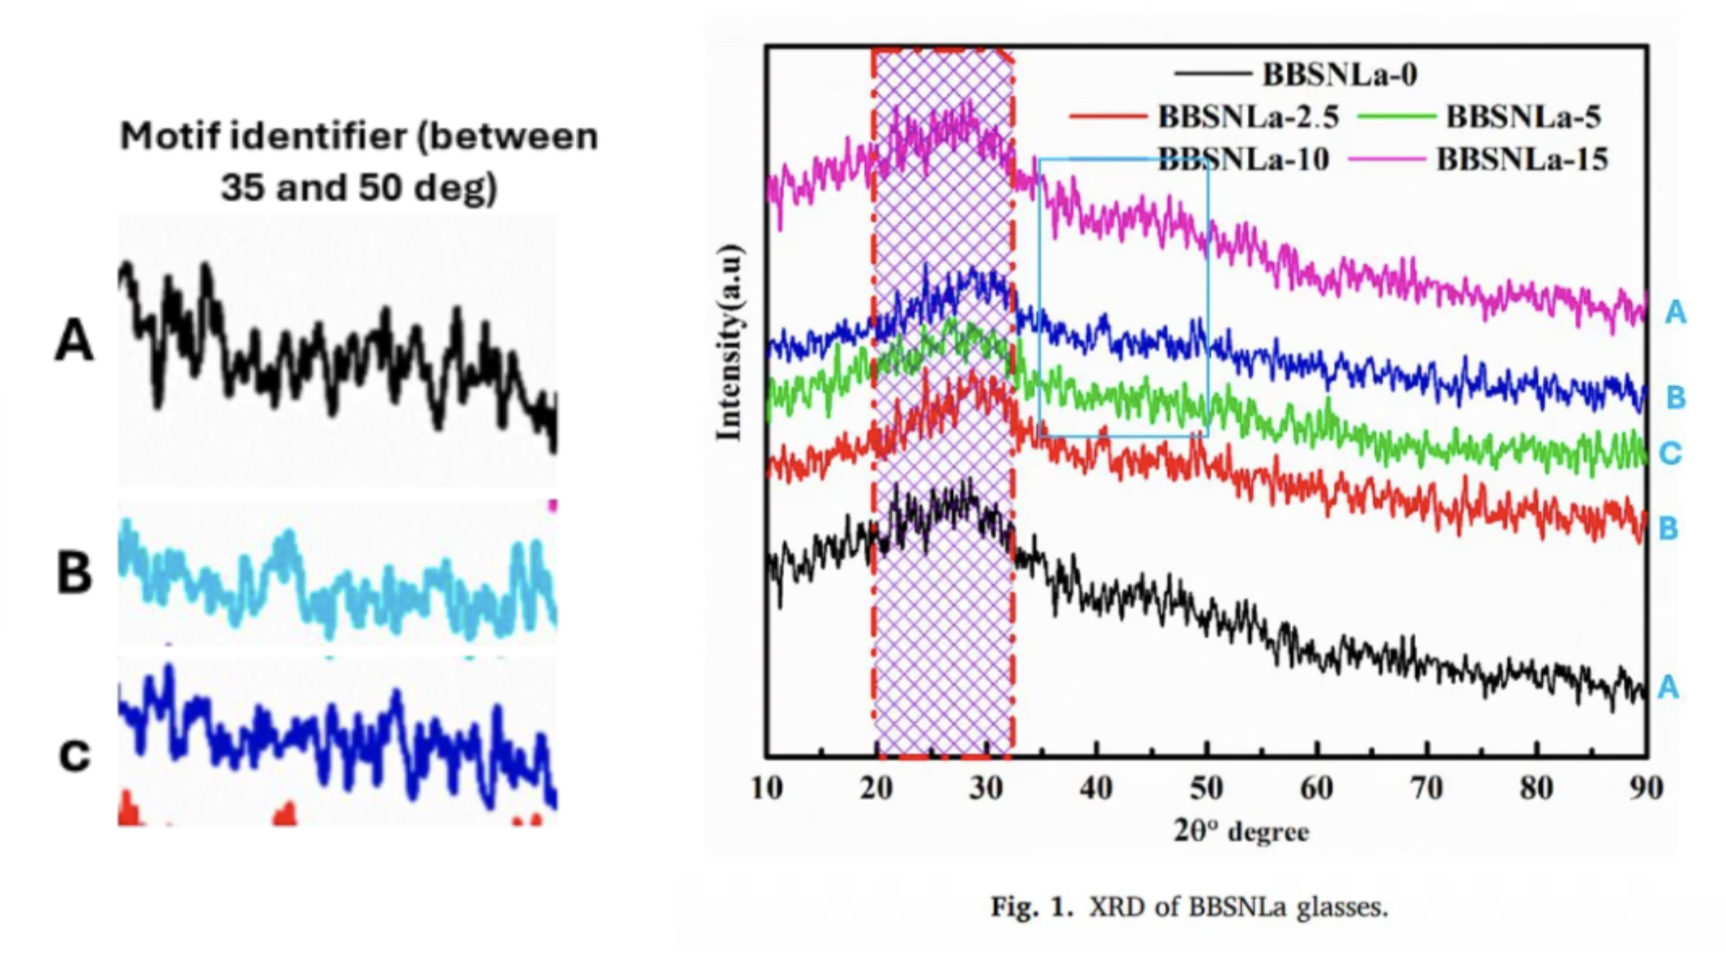
The core technique: anchor your eyes on one small section of the plot, say around 2-theta = 40 degrees, and run them straight down across all traces rather than scanning the whole figure at once.
The trickier lesson: traces that look completely different can still share the same underlying data, just with color, intensity, or waveform shape altered.
In one case study, she found just three recurring trace “motifs” reused across 72 different papers, once she built a visual key to spot them.
Patchwork is easiest to catch once you zoom into the image file itself, not the PDF preview.
Two more visual tells: pay attention to where traces end, since editors tend to focus effort on the middle of a figure and get sloppy at the edges, and treat unusually thick traces with suspicion, since a thick line makes it easier to hide a seam.
And then there’s the hand-drawn category, images that clearly didn’t come from an instrument but don’t technically violate any named rule, until they do, like a trace that abruptly reverses direction.
Mu Yang's Field Tips
- Anchor your eyes on a small section and remember it before scanning vertically across traces.
- Review the actual image file, not the version embedded in a PDF.
- Watch for chunky traces and check the ends of every plot.
- Binge a suspicious author’s papers in one sitting. Working memory fades fast, so cluster the review.
- Use the figure preview tools some publishers already offer (e.g. ScienceDirect).
- Zoom in. Always zoom in.
Imagetwin’s Vision is to Strengthen Manual Screening with Automated Detection
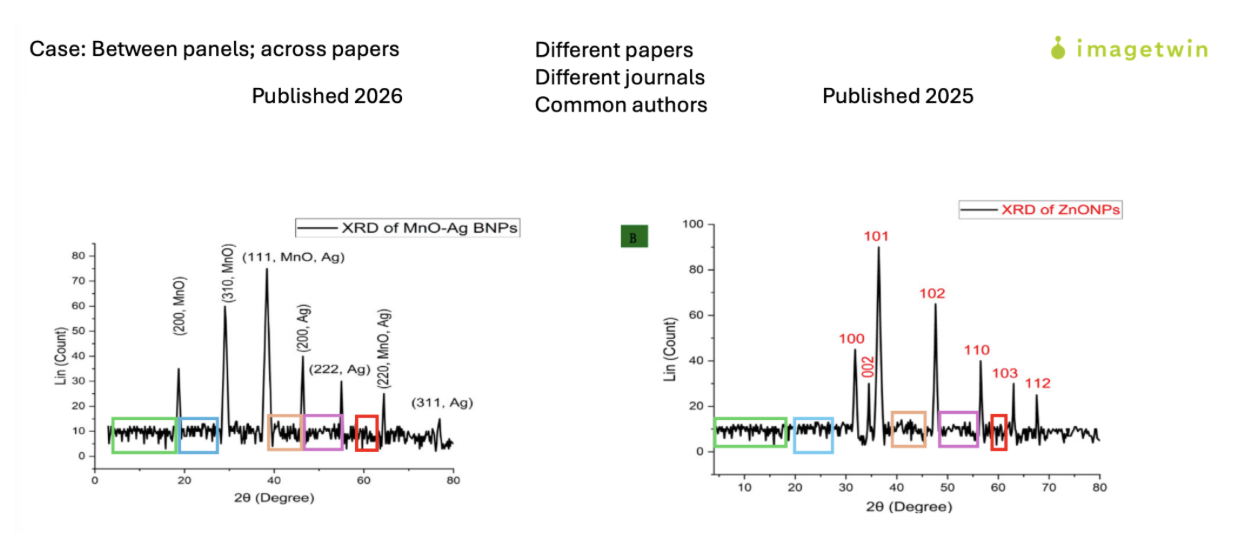
Marcus shared results from scanning 4,716 papers with XRD plots published in 2026: the new cross-paper reference database of over 374,000 XRD plots flagged 428 same-panel matches, 181 same-paper cross-panel matches, and 43 cross-paper matches, including cases spanning different journals with shared authors.
On the roadmap:
- Expanding XRD cross-paper detection through Q3/Q4 2026
- Bringing the same cross-paper matching built for XRD to other sub-image types, including graphs, diagrams, and plots
- A next-generation manipulation detection model
- Expanded AI-image detection support, including for ChatGPT Images 2.0.
Appreciation
All the examples, techniques, and insights in this recap come directly from Mu Yang. Thank you so much for generously sharing your expertise and your eye for detail with the community.
Watch the webinar recording on our Youtube or LinkedIn.