A clean-looking figure doesn’t mean nothing is wrong with it. Sometimes it just means no one has looked closely enough yet.
That is the working assumption behind Jana Christopher‘s job. Christopher is Image Data Integrity expert, she has been screening published and submitted figures for over 20 years, and she has trained integrity teams at the Royal Society of Chemistry, Elsevier, PNAS, Frontiers, MDPI, and eLife. In a live session with Imagetwin co-founder and CEO Patrick Starke, she walked through how she actually reviews a figure, live, in Photoshop, using two retracted papers as examples.
From a Courtesy Check to a Frontline Defense
When Christopher started, image screening was treated as a service to authors: a way to catch copy-paste errors and ambiguities before they became a problem. Journals expected to flag issues in around 20% of manuscripts and reject maybe one a year on integrity grounds. There were no automated tools.
That changed in 2018, when Christopher spotted a set of fabricated western blots: solarizing the images revealed identical background noise across supposedly independent panels. She found the same pattern in 16 other submissions and published a warning. Around the same time, other image sleuths traced hundreds of papers with the same squiggly-band signature to what became known as the Tadpole Paper Mill. Most have since been retracted.
Most Figures Aren't Fabricated, Just Confusing
Before manipulation even enters the picture, Christopher flagged a more common problem: figures that are technically honest but impossible to interpret correctly. A few examples she uses when screening:
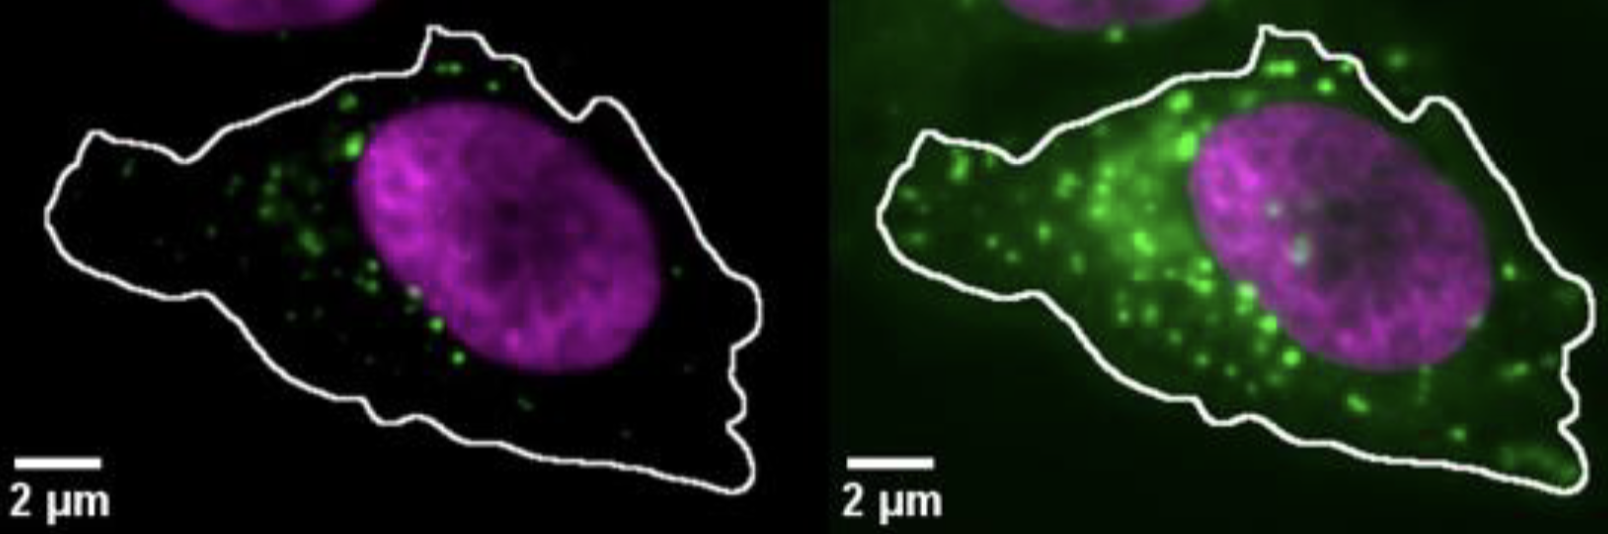
- Inconsistent acquisition or processing. If image intensities are being compared or quantified, the images need identical acquisition parameters and consistent processing, or the comparison is meaningless. Christopher showed the same microscopy image adjusted at two different brightness and contrast levels: the vesicle count that resulted was different both times.
- Missing, wrong, or badly placed scale bars. For some specimens, such as tumors, plants, or archaeological samples, a ruler inside the photograph is more reliable than a scale bar placed next to it.
- Color scales that start and end on the same shade, making it impossible to distinguish the top of a structure from the bottom.
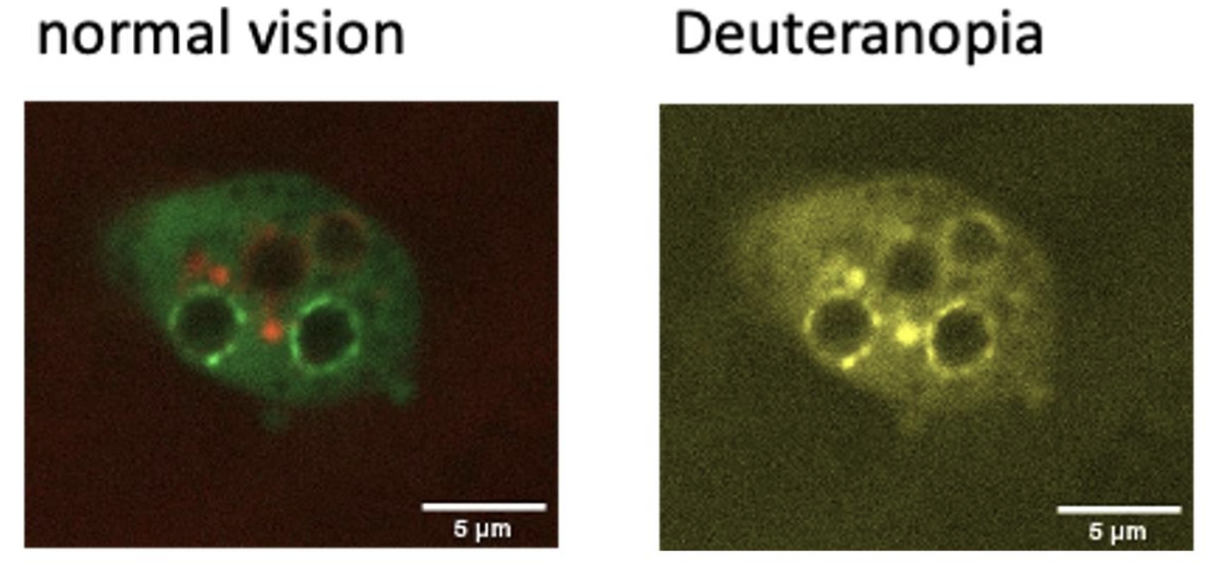
- Color choices that aren’t colorblind-safe. Red-green color blindness affects roughly 8 to 10% of men. A figure that relies on red and green together can be unreadable to a meaningful share of readers.
Christopher cited a 2021 analysis of 580 papers across top journals in plant sciences, cell biology, and physiology: only 10 to 20% had fully understandable image figures, and 45 to 70% had erroneous scale bar information. For a practical reference, she pointed to the QUAREP-LiMi working group’s 2024 checklist for image presentation and analysis, and to COSIG, the Collection of Open Science Integrity Guides.
Expert’s Image Integrity Screening Routine
Stripped down, Christopher’s process is a repeatable checklist rather than a gut check:
- Scan every figure by eye for anything that looks off.
- Group images of the same type across the figure set (all the western blots, all the microscopy panels) and tile them side by side to compare directly for duplication.
- Look for alterations, doctoring, and processing irregularities such as over-contrasting.
- Separate the color channels in multi-channel or merged images: sometimes only one channel has been edited, or the channels don’t line up.
- Check scale bars, magnification, and whether magnified insets are correctly marked in the source panel.
- Check whether bar graphs, plots, and charts are plausible, and look for duplicated or repeating patterns.
- Check animal welfare compliance, such as tumor volumes against ethical limits.
Expert’s Image Integrity Screening Routine
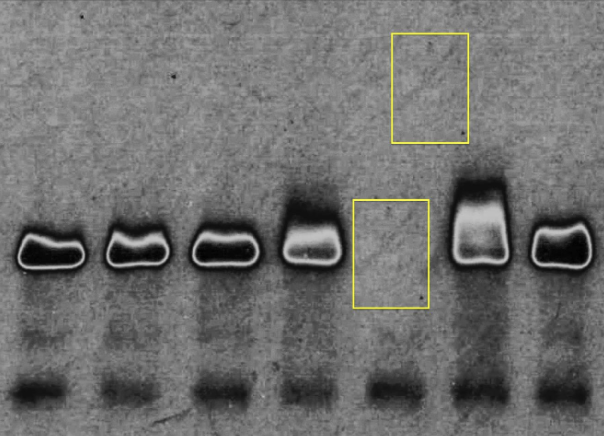
To show how little effort it takes to alter scientific data, Christopher used Photoshop’s clone tool to erase and overwrite a band on a mock gel image, a change that took under a second. Solarizing the resulting image made the doctored area obvious: the background pattern in the overwritten region matched a nearby area exactly, which does not happen by accident.
It’s the same technique Christopher used to catch the original Tadpole Paper Mill blots in 2018, and one she asked Imagetwin to build directly into the software, so analysts can solarize an image without exporting it to Photoshop first.
What Raw Data and Metadata Matter
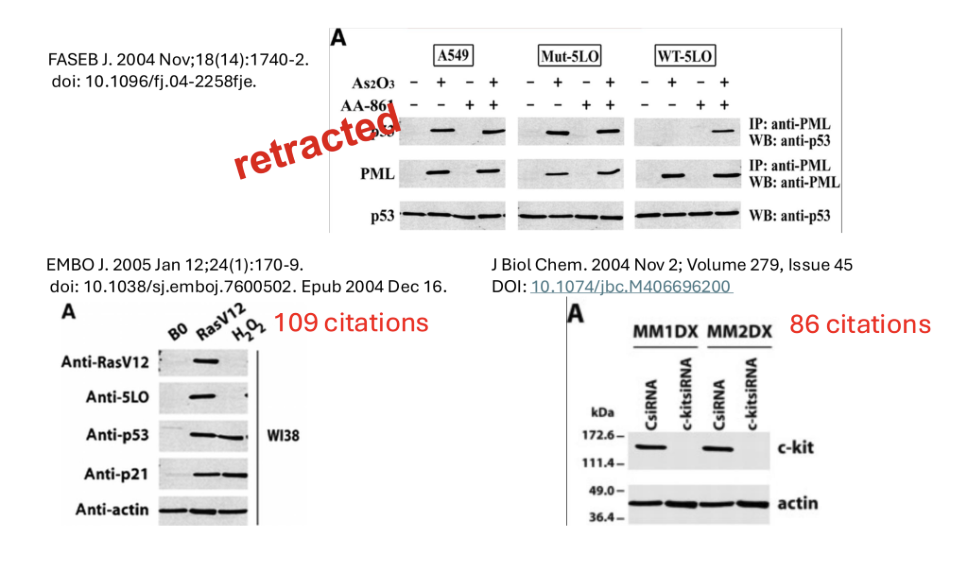
Christopher can’t discuss specific FEBS Press manuscripts she has rejected: publicizing raw data or findings from a rejected submission would breach peer review confidentiality, something she noted paper mills are well aware of and rely on. So for the live demonstration, she used figures from two retracted papers instead: one from the FASEB Journal and one from Nature, retracted within six months of publication and the subject of 51 PubPeer comments.
Working through them in Photoshop, she pointed out panels with no scale bars at all, inconsistent black levels between panels that should have been acquired under identical conditions, and hard edges around a set of nuclei that gave away a composite image assembled from at least two source files. Both papers, she noted, had continued to accumulate citations after retraction, 109 and 86 respectively in the examples she showed, which is part of why catching problems before publication matters as much as it does.
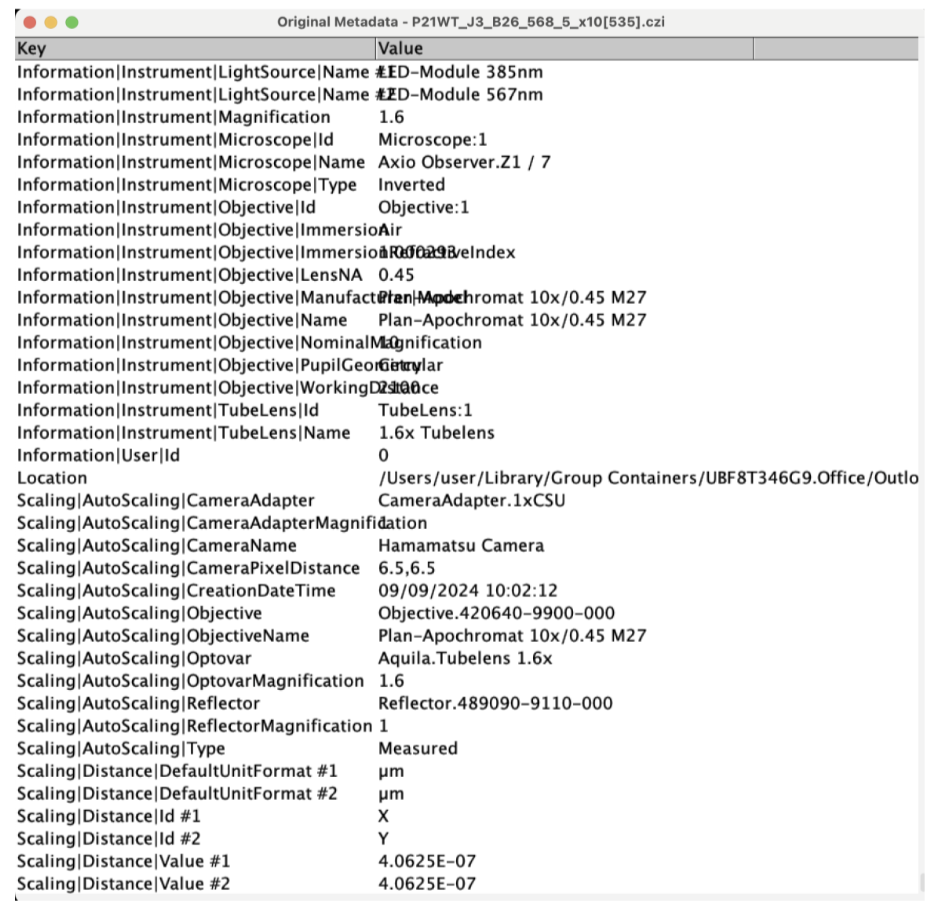
Where raw data is available, it typically settles the question outright: original files and their metadata (acquisition timestamps, software history, camera and instrument details) either support an author’s explanation or contradict it.
As Christopher put it, most of her job is asking the right questions and taking them to the editors, who decide what happens next.
Thank you to Jana Christopher for walking us through her process so openly and generously, it’s a rare look at what careful, experienced image screening actually looks like in practice.